Veridical Data Science
The Practice of Responsible Data Analysis and Decision Making
This is the Open Access web version of Veridical Data Science. A print version of this book is published by MIT Press. This work and associated materials are subject to a Creative Commons CC-BY-NC-ND license.

To our families.
Preface
The rise of data science over the last decade has received considerable attention in the media, contributing to an explosion in the number of data science jobs being created across a range of industries such as technology, medicine, manufacturing, and finance. A quick Google search yields thousands of job openings for data scientists across the United States, and worldwide. In academia, data science institutes are rapidly being created at universities, including at the University of California, Berkeley, our home institution. As a result of today’s massive quantities of data and sophisticated computational technologies, the practice of data science is now helping us to mitigate the impacts of climate change, provide personalized medical care to patients, uncover important chemical structures for drug discovery, and even understand the origins of the universe.
While the term “data science” itself has only fairly recently found its way into common usage, the practice of data science (using data to answer real-world domain questions) has had a long history, existing under many other names, including “data analysis” and “applied statistics.” One of the earliest instances of using a “computer” to solve a real-world statistical problem comes from Herman Hollerith (1860-1929) and the punch cards that he created to help process the overwhelming (back then, at least) amount of data from the 1890 US Census. These punch cards were essentially an early version of the binary data storage format still used in today’s computers. This revolutionary Hollerith machine led to the development of one of the four companies that later combined to become today’s IBM. To learn more about the history and formation of data science, we highly recommend David Donoho’s article “50 Years of Data Science” (Donoho 2017).
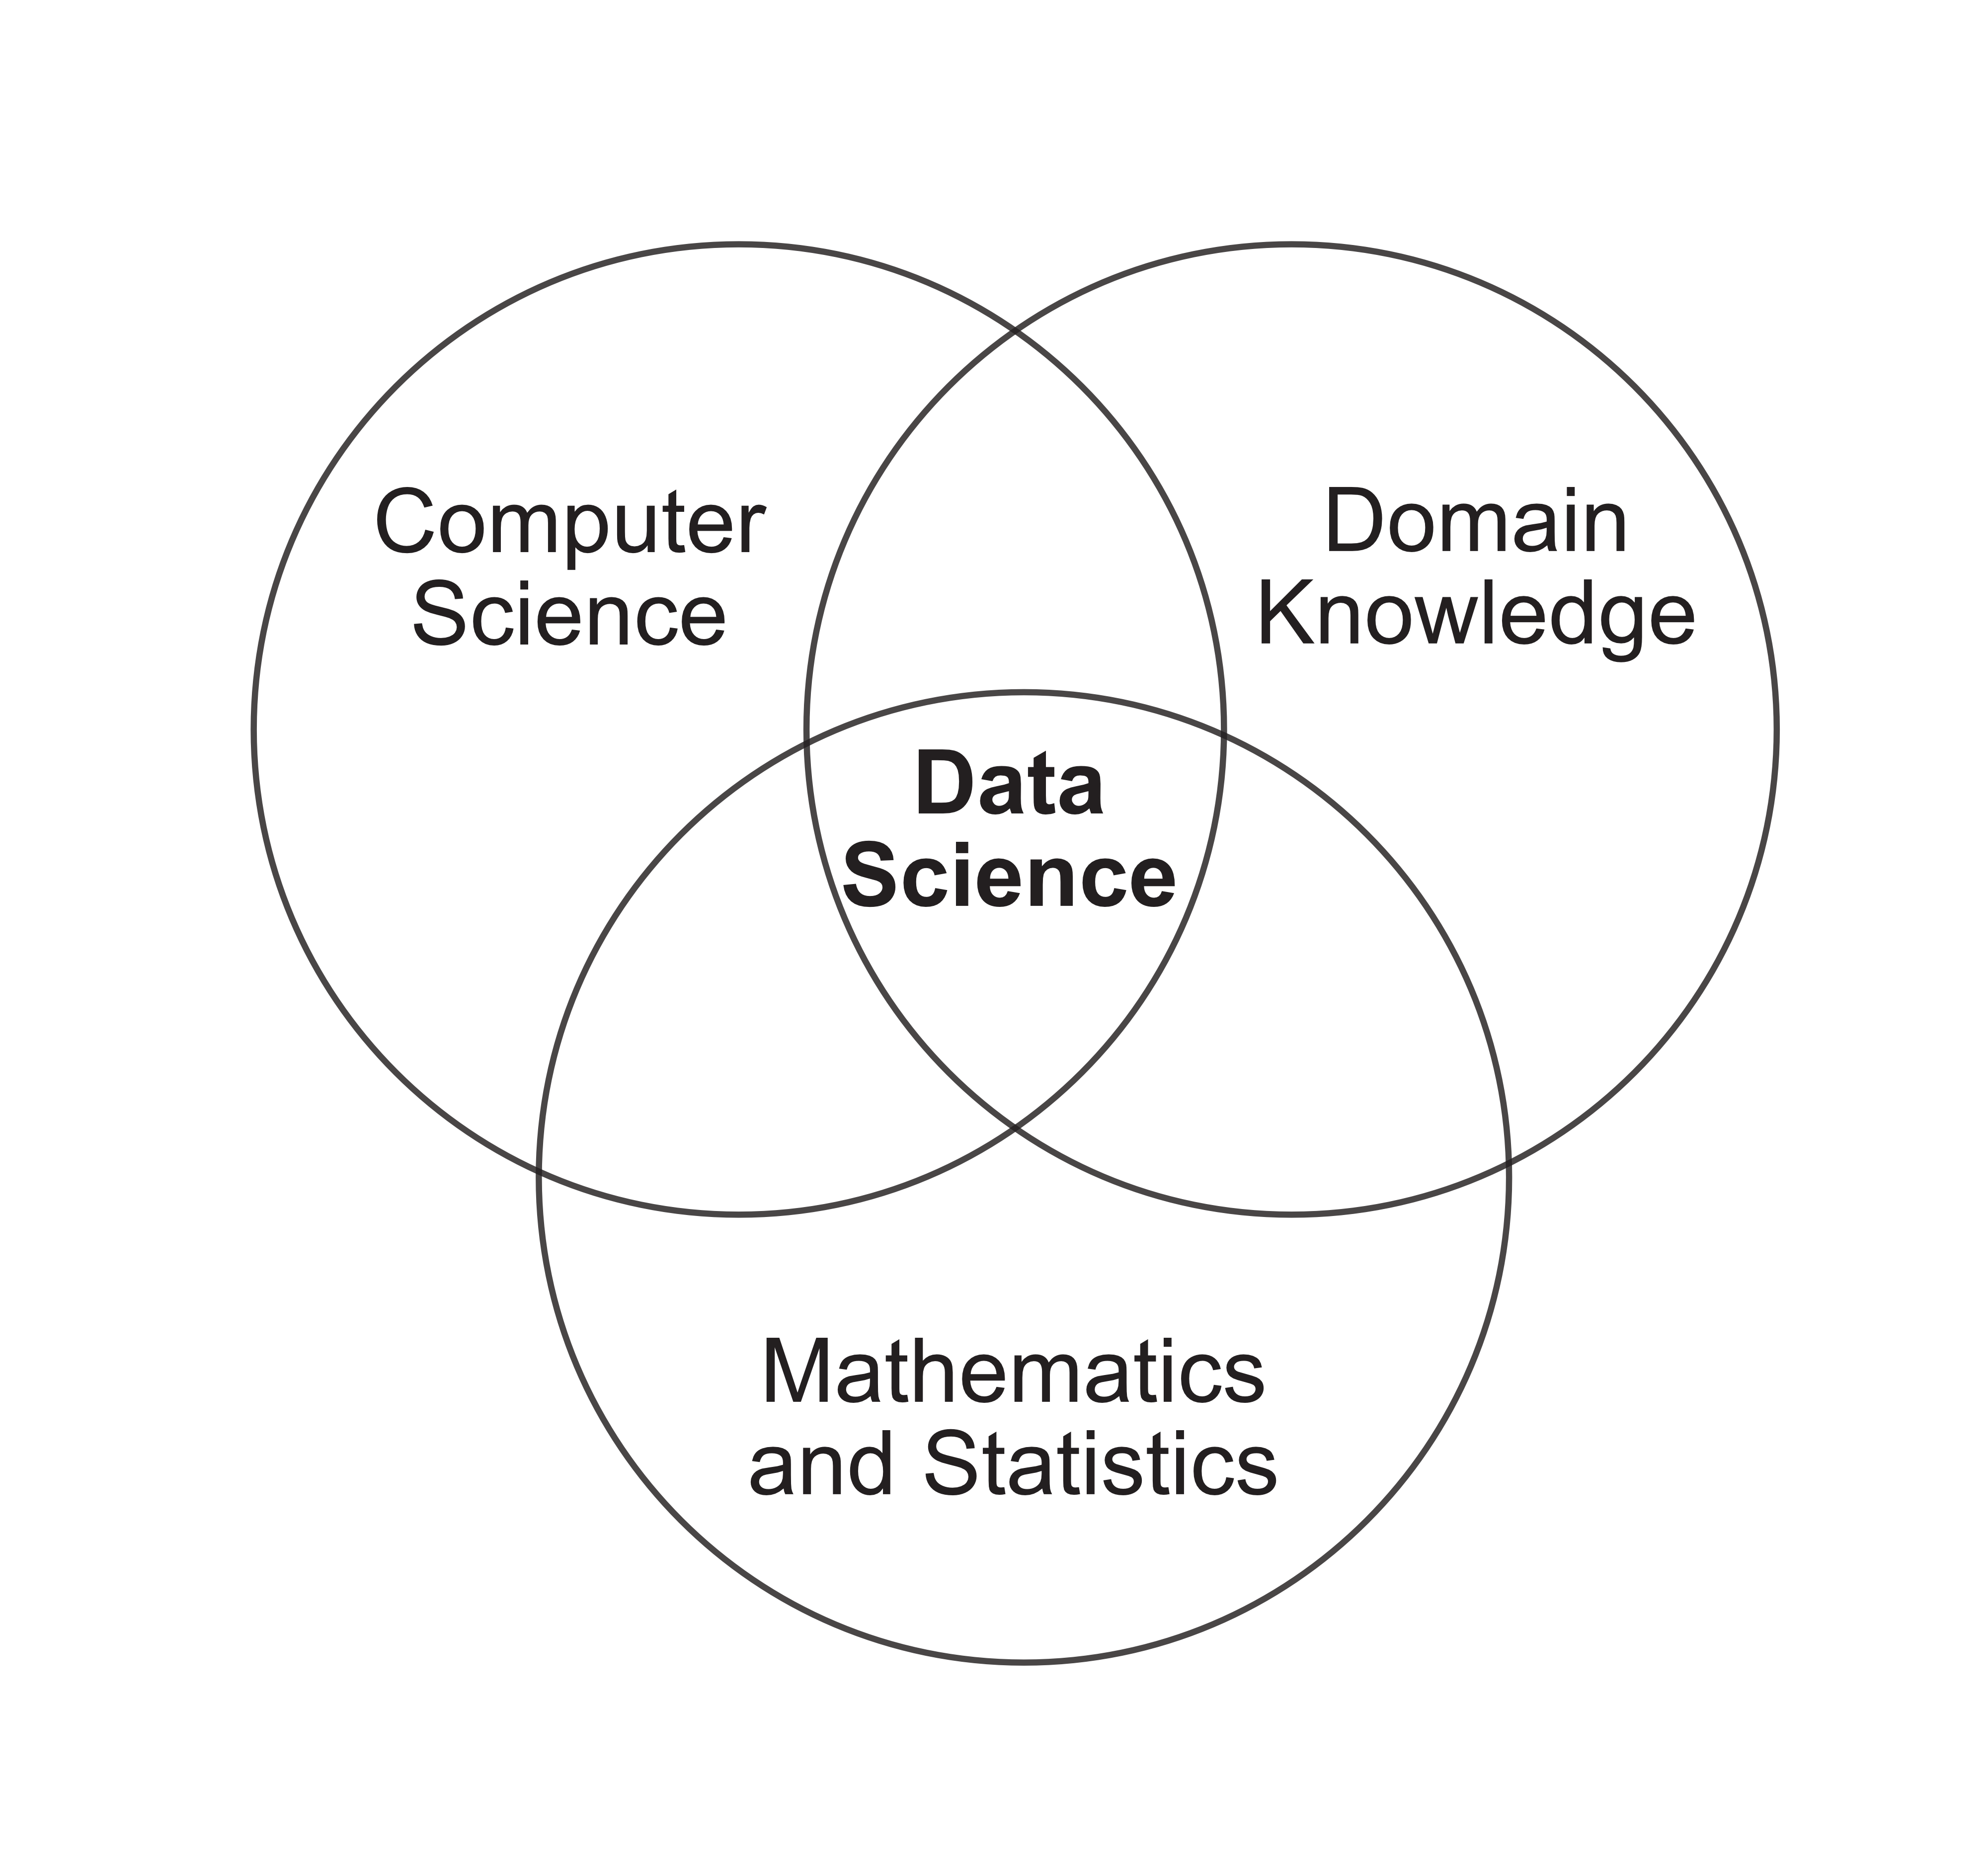
Despite its rapid growth in all sectors, there is surprisingly little consensus on what exactly data science is. Most people will agree that data science lies somewhere at the intersection of
Computer science: The development and use of computational techniques to solve problems and answer questions
Statistics/mathematics: The development and use of mathematical and statistical techniques to solve problems and answer questions
Domain knowledge: Knowledge of background information that underlies the problem or question being asked
This idea is reflected in the Venn diagram in Figure 1 (inspired by a similar diagram originally created by Drew Conway).
A data scientist needs to simultaneously be an expert in writing code and solving mathematical and statistical data-driven problems, while also thinking critically and communicating clearly in a range of scientific or business domains. The job of a data scientist involves computationally extracting meaningful insights from complex datasets and then communicating their findings to a range of audiences to enhance understanding and inform domain decision making. Consider, for example, a data scientist who is working on a project whose aim is to predict which patients in a hospital are at high risk of readmission using information from electronic medical records. The overall goal of this project is not only to extract readmission information from electronic medical records (a complex dataset), but it is also to communicate this information to the doctors who need to make decisions on whom to discharge.
Data science is not simply a subfield of statistics or computer science. Instead, it is the integration of statistical and computational thinking into real-world domain problems in science, technology, and beyond. Since data science projects are grounded in real-world problems, it is thus important that data scientists work side by side with domain scientists or experts to ensure that their data-driven results provide useful, ethical, and trustworthy solutions to the real-world domain problem.
In Bin Yu’s own data science research group at the University of California, Berkeley, statisticians and computer scientists work alongside scientists to solve real-world domain problems and answer scientific questions such as “How do neurons in the brain’s visual cortex help us process visual information?” (Nishimoto et al. 2011), “How do embryonic fruit flies form their organs?” (Wu et al. 2016), “How does the brain respond to visual stimuli (such as from movies and images)?” (Nishimoto et al. 2011), “How can we differentiate between clouds in polar regions in satellite imagery?” (Shi et al. 2007), “How can we concisely summarize text documents using natural language processing (NLP)” (Jia et al. 2014), “How can we extract diagnostic information stored in pathology reports using NLP” (Odisho et al. 2020), and “Which subgroups of patients are more likely to experience side effects when taking certain drugs?” (Dwivedi et al. 2020). The fact that such a variety of projects can be explored within a single data science research group serves as a true testament to the universal applicability of data science in finding data-based solutions to real-world problems in an array of fields.
A primary focus of this book will involve developing techniques for demonstrating that every data-driven result that you produce is trustworthy. However, whether a data-driven result is considered trustworthy largely depends on the context in which it will be applied. For instance, if you have identified several risk factors of hospital readmission using data collected from American patients in American hospitals, how do you know that these risk factors can be trusted when they are instead used to identify European patients at risk of readmission to European hospitals? The key is showing that your analysis generates predictable results in the specific real-world domain context in which you intend to apply them (i.e., you need to show that the readmission risk factors that you identified are also relevant for European patients and hospitals before using them to identify European patients at risk of readmission to European hospitals).
However, it is also important to realize that every data-driven result itself is an imperfect reflection of reality. There is no guarantee that the data-derived readmission risk factors identified for American patients are actually capturing real-world risk factors of readmission for these patients. For any given dataset that you collect, there are many alternative versions that you could have collected (i.e., there is uncertainty arising from the data collection process), and for any given analysis that you conduct, there are many alternative analyses that you could have implemented (i.e., there is uncertainty arising from the analyses that you choose to conduct). The uncertainty associated with a data-driven result corresponds to the extent to which the result could have plausibly ended up being different (can you think of other sources of uncertainty that often underlie data-driven results?). The question is: How sensitive—or stable—are your data-driven results and conclusions to the sources of uncertainty that underlie them? If the answer is “very sensitive,” then how much should you trust any individual version of the data-driven results that you have produced?
While there is a wide range of statistical and computational tools for conducting data analysis, there does not yet exist a general framework for demonstrating that the subsequent data-driven results actually correspond to a trustworthy answer to a domain problem. This is where veridical data science comes in.1
The word “veridical” means “truthful” or “coinciding with reality” and we define “veridical data science”2 as the practice of conducting data analysis while making human judgment calls and using domain knowledge to extract and communicate useful and trustworthy information from data to solve a real-world domain problem.
What Is Veridical Data Science?
Rather than simply being a toolbox of algorithms (which is how many people think of “data science”), veridical data science spans the entire data science life cycle (DSLC). The DSLC describes the nonlinear problem-specific path traveled by every data science project. It starts with problem formulation, data collection, and data cleaning and traverses through multiple types of data analyses to arrive at an assessment of some data-derived results, which is then communicated to a domain audience. The view of data science as a multi-stage process can be attributed to Box (1976) and Cox and Snell (1981).
This data science workflow is often presented as a straightforward, linear analytic process that involves formulating a well-defined problem that can be answered by conducting an appropriate analysis of some readily available data. However, if you’ve ever worked on a real data science project, you will know that this is a massively oversimplified view of what it is like to conduct data science in practice. Most real data science projects start with a frustratingly vague domain question, which you must answer with an exasperatingly messy dataset riddled with ambiguities and errors (and that was most certainly not collected with your particular project in mind), and involves embarking on a winding journey of analyses whose underlying assumptions don’t quite fit the data you have. In the end, what you usually have to show for your months (or years) of hard work is a set of depressingly inconclusive results.
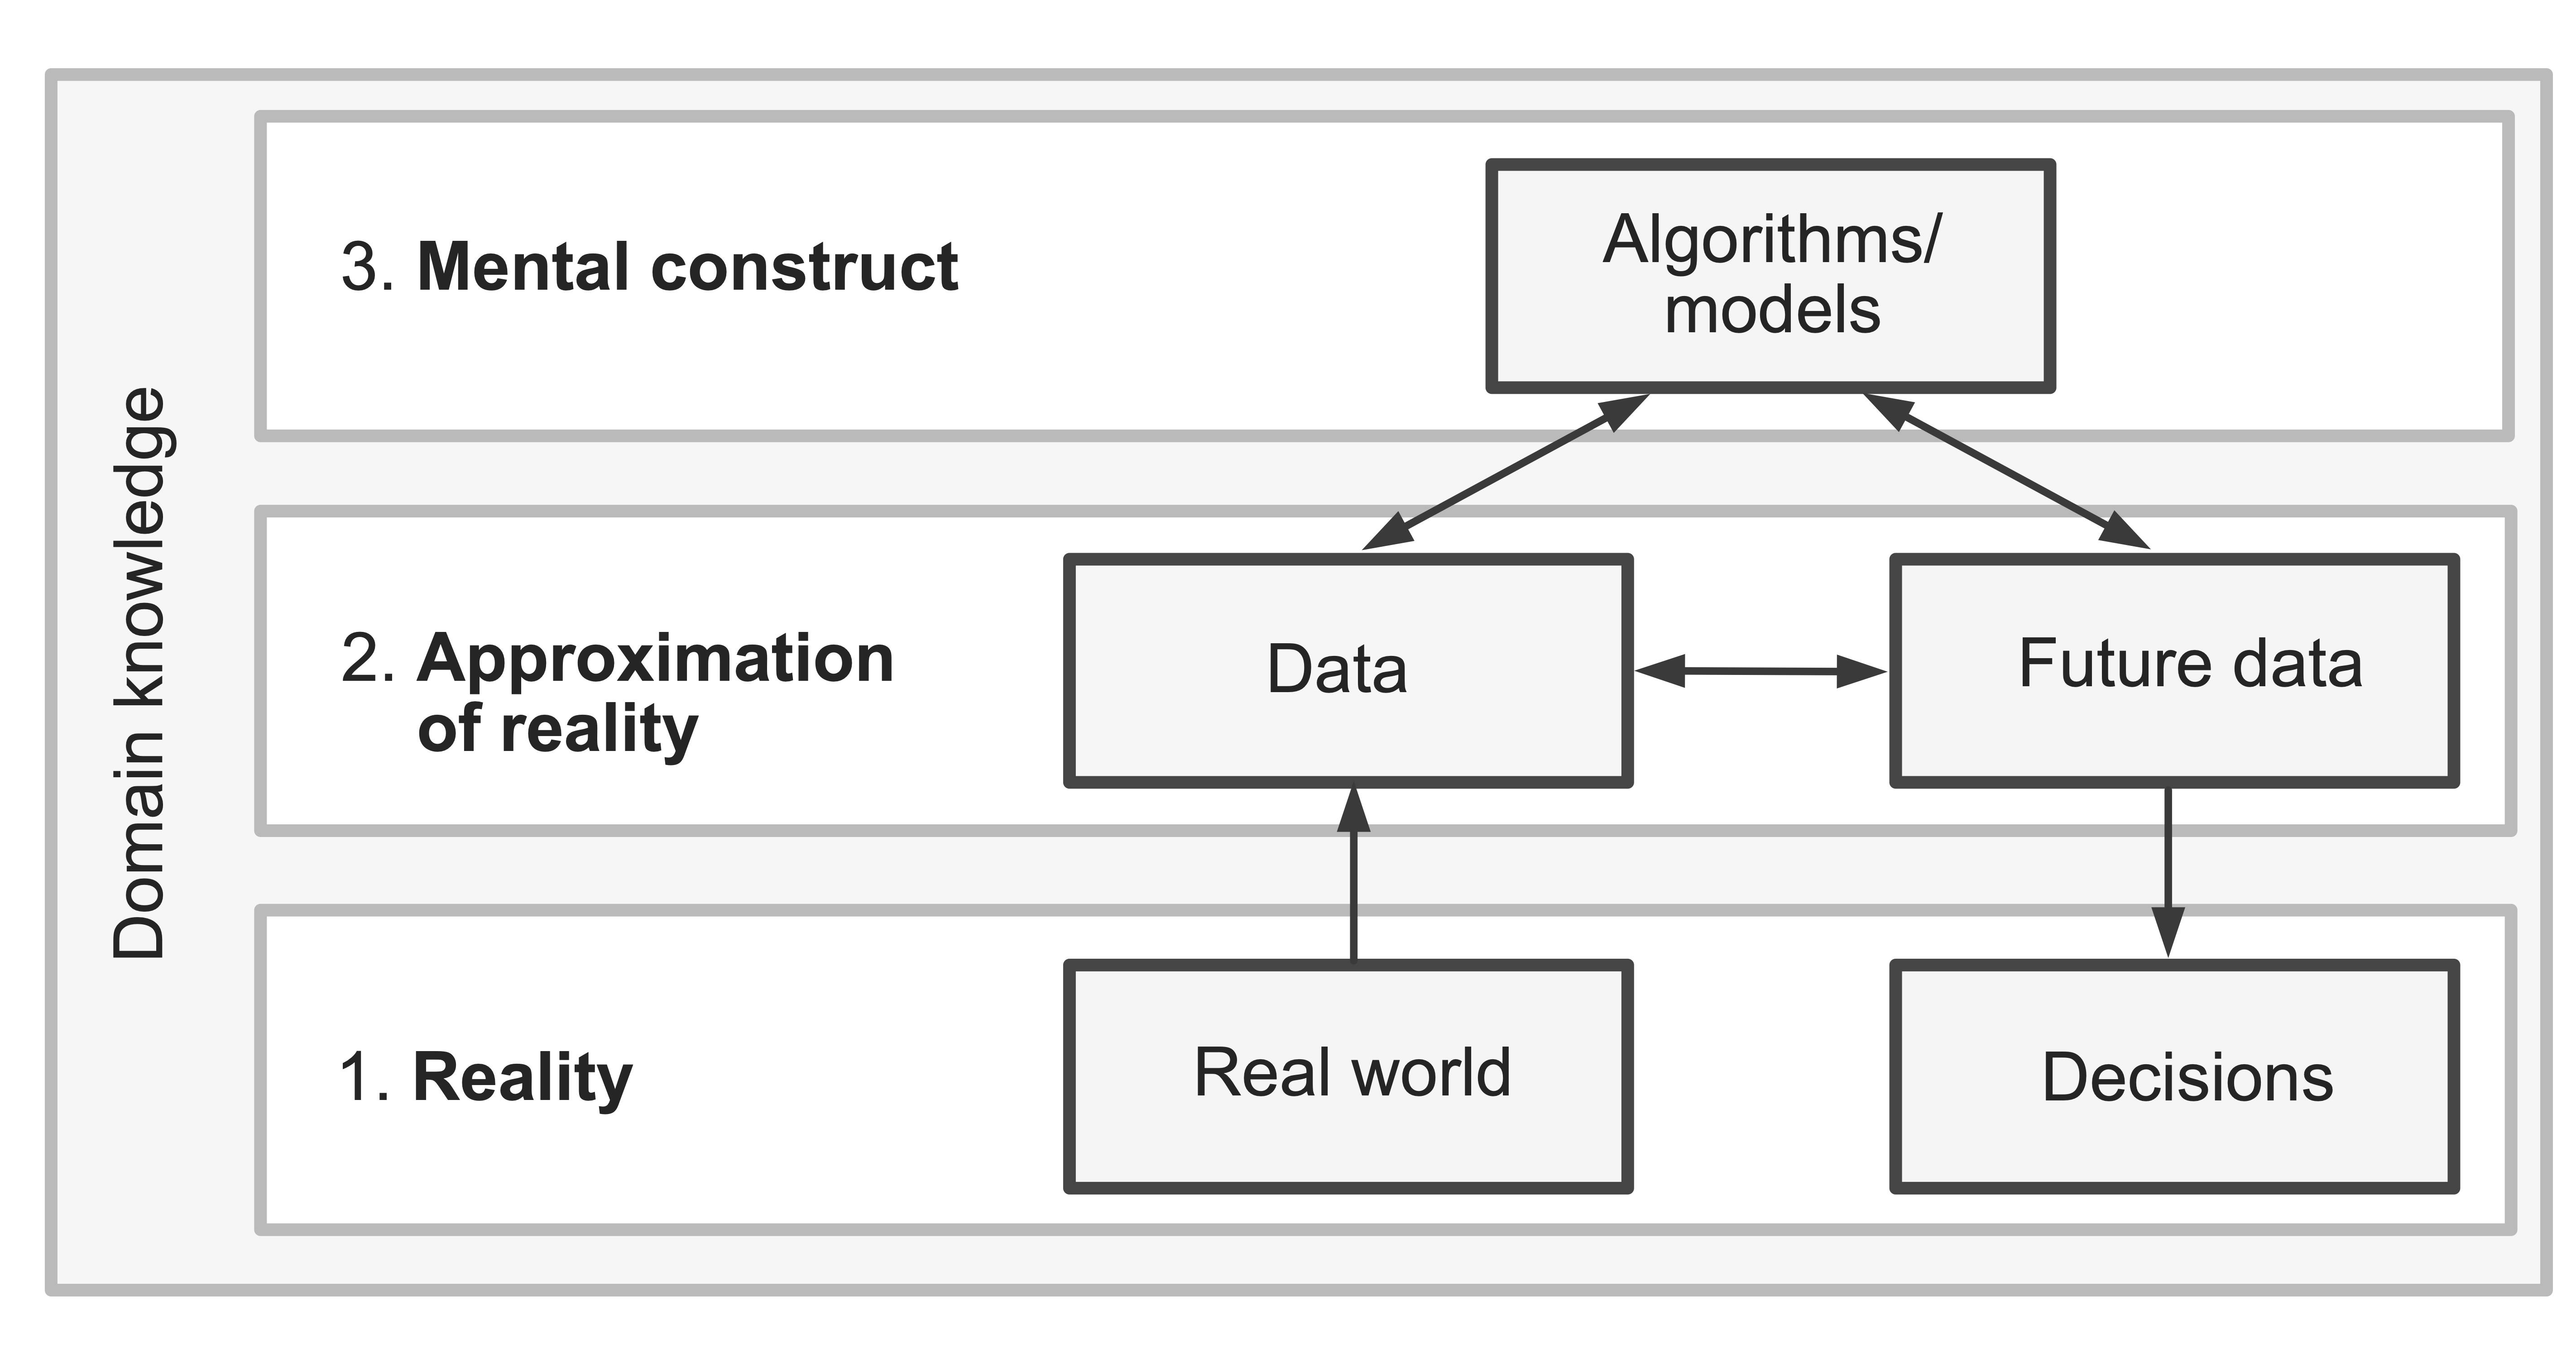
Veridical data scientists live in the real world, and so do their analyses. The first step of being a veridical data scientist is to realize that our data represents an approximation of reality rather than reality itself. Every real-world dataset is just a crude snapshot of a collection of (often imprecise) measurements whose values we were able to observe at a particular moment in time.
Not only does our data not perfectly capture reality, but neither do our analyses. The analyses that we conduct on our data are mental constructs, whose use should be justified based on the data itself, along with relevant domain knowledge (rather than based on unrealistic assumptions about what our data looks like and how the real world behaves).
As veridical data scientists, our work thus spans the three realms: reality, an approximation of reality (the data), and mental constructs (the analyses/algorithms), depicted in Figure 2. The trustworthiness of our data-driven results depends heavily upon (1) the current data that we are conducting our analysis on and (2) the future data that we are applying our conclusions to being an effective approximation of reality, as well as our analyses and algorithms involving realistic assumptions and capturing relevant patterns.
Rather than hiding the imperfections within our data and analyses, the veridical data science framework that we will introduce in this book not only acknowledges—but actively embraces—them as transparently as possible across a range of data science problems. Veridical data science offers a framework for assessing the trustworthiness of your results by demonstrating that they are relevant to (or predictable in) the real-world scenario in which they will be applied, and by actively examining a range of sources of uncertainty using a series of stability explorations, all within the real-world context of the domain problem.
This framework is called the predictability, computability, and stability (PCS) framework.3 You can show that your results are predictable by computationally demonstrating that they reemerge in relevant future data and are in line with domain knowledge (predictability can be thought of as a reality check), and you can show that they are stable by computationally demonstrating that they do not change dramatically when appropriate changes are made throughout the DSLC. By computationally demonstrating that your results are predictable and stable, you are providing evidence that your data-driven conclusions (and subsequent real-world decisions) are trustworthy and relevant to reality.
The Structure of This Book
The goal of this book is to demonstrate, using real-world data examples, how to practice veridical data science using common data science techniques. This book is split into three parts:
Part I: An Introduction to Veridical Data Science. The first part introduces the concepts needed for practicing veridical data science. We will introduce the PCS framework, outline the DSLC, and describe many computational concepts that will be helpful for implementing the examples and techniques that are presented in parts II and III of this book, including how to organize your veridical data science project on your computer, the principles of writing efficient code, and using Git and GitHub.
Part II: Preparing, Exploring, and Describing Data. The second part focuses on data cleaning, preprocessing, and data exploration. Even though every data science project involves cleaning and preprocessing data in some capacity, very few texts discuss it in any real detail. But spending time conducting the drudgery of cleaning your data is critical for understanding it. Much of the content of part II revolves around introducing techniques for developing an understanding of the hidden patterns and trends contained within your data using techniques such as data visualization, as well as techniques of dimensionality reduction and clustering. You will start to see the PCS framework in action in increasing detail as you progress through part II of this book.
Part III: Prediction. The third and final part of this book focuses on problems of prediction. It will introduce a range of techniques for generating predictions that can be used for decision making based on a range of common statistical and machine learning (ML) algorithms. By the time you reach part III, you will be comfortable conducting general PCS evaluations to evaluate the trustworthiness of general data science results. In this part, you will be guided through adapting these general PCS evaluations to the context of developing trustworthy predictions.
In Parts II–III, you will find detailed demonstrations of a wide range of relevant techniques in practice across several veridical data science case study projects, ranging from understanding the global organ donation trends to predicting whether a visitor to an e-commerce website is likely to make a purchase. Instructors hoping to teach using this book are encouraged to replace the case studies with examples from their own research and associated domain knowledge.
At the end of each chapter, you will find exercises and additional projects that will allow you to practice the concepts that you’ve just learned.
Supplementary R and Python code as well as the data that accompanies each case study in this book can be found on GitHub (https://github.com/Yu-Group/vds-book-supplementary). The exercises in Chapter 3 will walk you through “cloning” (downloading) this GitHub repository to your computer.
This book will teach you how to ask insightful data-driven domain questions; how to think critically about data in the context of the question being asked; how to clean and format your data; how to structure your analyses; and how to scrutinize the trustworthiness of your resulting data-driven results, while also providing an intuitive introduction to a range of common statistical and ML algorithms used widely in data science, such as principal component analysis, clustering, least squares, and random forest.
What This Book Does Not Contain
It is important to note that this book will not teach you how to code, nor will it teach you all the technical mathematical and statistical theory that underlies the common data science techniques (that’s not to say that these things are entirely absent from this book, but they are certainly not the focus).
Fortunately, there are already many excellent books that teach these things: Mathematical Statistics and Data Analysis (Rice 2007) and Statistical Models: Theory and Practice (Freedman 2009) are both fundamental texts in mathematical statistics; The Elements of Statistical Learning (Hastie, Friedman, and Tibshirani 2001) covers the technical mathematical and statistical details of a range of statistical and ML methods, and R for Data Science (Grolemund and Wickham 2017) and Python for Data Analysis (McKinney 2017) are excellent resources for learning how to code in R and Python, respectively.
In addition to general coding and theory, observant readers already familiar with statistics may have noticed another significant omission from the topics covered in this book: the topic of statistical inference, which traditionally involves using techniques such as hypothesis testing and confidence intervals to address the uncertainty associated with data-driven parameter estimates in the context of sampling variability. These traditional statistical inference uncertainty assessments ask about the extent to which data-driven parameter estimates (such as a population mean) might look different if a slightly different dataset was collected under the same hypothetical sampling process that generated the original data.
It is important to note that this omission does not reflect a belief that inference is unimportant. Rather, it arose because the practice of inference within the context of the PCS framework (that we introduce in this book), which involves a greatly expanded view of uncertainty, is still under development. Instead of presenting a traditional statistical perspective on inference (which has already been thoroughly covered in various other books, such as Rice’s Mathematical Statistics and Data Analysis) or presenting an incomplete version of our own PCS inference framework, we reluctantly decided to exclude the topic of inference for parameter estimation entirely. Fortunately, the Yu research group is actively working on developing a PCS-based approach to inference for parameter estimation, and many ideas underlying PCS inference can also be observed in our PCS-based approach to prediction problems described in part III of this book. Keep an eye out for more details on a PCS-based inference framework, as well as extensions of veridical data science and the PCS framework into a range of fields such as veridical spatial data science (Kedron and Bardin 2021), veridical network embedding (Ward et al. 2021), and reinforcement learning (Trella et al. 2022).
Finally, while many different topics are involved in the practice of responsible data science, the PCS framework of veridical data science described in this book focuses primarily on just one aspect of responsible data science—namely, the process of demonstrating the predictability and stability of data-driven results in new scenarios and under reasonable perturbations, respectively. While the PCS framework is critical to the practice of responsible data science by providing evidence for the trustworthiness of results, it does not focus on equally important topics such as ethics, fairness, and privacy in data science. These topics are key to preventing the introduction or amplification of societal inequalities, protecting personal privacy, and combating the spread of disinformation that can arise from using data science to make real-world decisions. Fortunately, however, several other available resources specifically address these important issues. One such resource is the free online course called “Practical Data Ethics” offered by fast.ai, which focuses on these issues in the field of ML. You can find this course at https://ethics.fast.ai/.
Use of Mathematical Equations
The mathematical content of this book is designed to be accessible to those without a strong mathematical background, but you will get the most out of it if you have at least taken some introductory calculus and linear algebra classes. Although we don’t stay away from mathematical formulations entirely, we restrict their usage to when it is actively helpful for explaining a concept and providing intuition.
Rather than focusing on introducing analytic methods using precise mathematical details and proofs, we instead aim to provide the intuition and critical thinking skills needed to arrive at an understanding of these methods. Our goal is to provide an understanding of why each method makes sense in the context of the data problem we are trying to solve, rather than motivating each method from a mathematical perspective. For every equation in this book, we explicitly articulate the connection of each term to a relevant, measurable quantity related to the domain problem at hand. By avoiding dense jargon and unnecessary mathematical notation, readers, especially those new to these technical concepts, will be able to arrive at an intuitive understanding of how and why certain techniques make sense, rather than getting lost trying to digest pages and pages of dense mathematical detail.
Use of Code
Aside from a few small pieces of R code included to demonstrate an idea, this book does not contain any code. We do, however, provide detailed code examples for both R and Python for each project introduced in this book. The R and Python code files can be found in the online GitHub repository that can be found at https://github.com/Yu-Group/vds-book-supplementary. We will refer to the relevant files in this GitHub repository throughout the book for those of you who want to follow along (which is recommended).
However, although this code is rich in comments and explanations, it may be challenging to follow if you are brand new to programming. Note that the PCS analyses in particular involve quite advanced code, and we recommend keeping a tab with R for Data Science (https://r4ds.had.co.nz) or Python for Data Analysis (https://wesmckinney.com/book/) open as a reference. By shifting the focus of the book away from the nitty-gritty details of programming and instead focusing on critical thinking (and by providing resources for both R and Python users), the general ideas presented in this book are intended to be programming-language agnostic.
Terminology and Important Concepts
Whenever new terminology is introduced and defined in this book, it will be written in boldface text. Important concepts and summaries are often displayed in a box.
Exercises
Each chapter in this book concludes with some combination of the following six types of exercises: (1) true or false exercises, (2) conceptual exercises, (3) reading exercises, (4) mathematical exercises, (5) coding exercises, and (6) project exercises.
True or false exercises ask for a simple explanation of whether a statement is true or false, whereas conceptual exercises ask you to provide a slightly more detailed explanation or description of a concept or to solve a conceptual problem. Reading exercises provide some relevant papers and other documentation to read. Mathematical exercises require you to use mathematical reasoning to test your understanding of a technique. None of these types of exercises will require that you write any code.
Coding exercises will require you to solve a specific data-based problem by writing some code. These exercises will involve a more guided analysis than the project exercises, which will encourage you to conduct your own free-form analysis of a new dataset using the concepts covered in the chapter.
Solutions to the true or false exercises are provided at the end of the book.
References
Veridical data science was first introduced in Yu and Kumbier’s 2020 paper, also titled “Veridical Data Science” (Yu and Kumbier 2020).↩︎
The name “veridical data science” was originally suggested to Yu and Kumbier by Professor Tian Zheng.↩︎
The PCS framework was introduced in the original “Veridical Data Science” paper (Yu and Kumbier 2020).↩︎